The Varroa load was high this year, because autumn stayed warm for a long time. As a result, the colonies continued to breed for a long time, which played into the hands of the Varroa population. The consequences of this will become apparent in the spring of 2023.
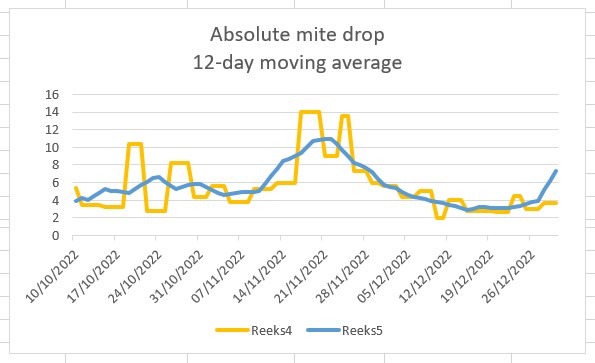
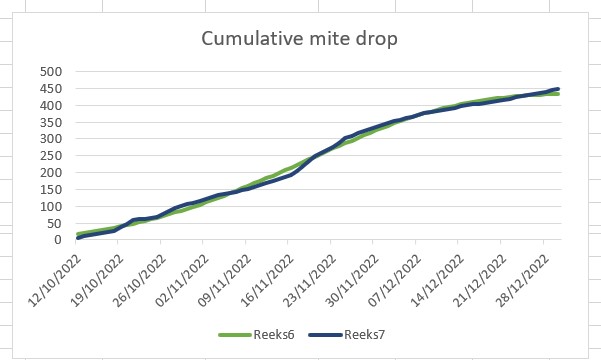
I determine the Varroa pressure solely by counting mites on the bottom board. Hence, the natural mite drop, determined over a long period, from the beginning of autumn to deep winter, and also from the beginning of the year to late spring. I convert the counting results into the average mite fall per day. There appear to be large fluctuations, resulting in an erratic curve. That is why I also calculate the 12-day moving average and the cumulative mite fall over the entire counting period. These values give a much more reliable picture of the dynamics of the mite population. This makes differences between colonies more clearly visible.
The cumulative mite drop generally shows an S-shape, as we often see in nature. After a slow start, a more or less steep slope follows, which eventually flattens out again. In some colonies the curve is linear, so a straight line, without flattening. Still other colonies show an exponential curve, leading to an explosion of mites. Colonies with these kinds of curves drop out for propagation.
At some point of time in fall or early winter, the mite drop per day decreases. This is a sign that the brood nest is decreasing in size. The mite fall per day will remain low from now on until brood appears again in spring. The often used threshold value for chemical control of 1 fallen mite per day in December seems rather strict to me. In addition, this value does not take into account the size of the bee colony. After all, in a large colony more mites fall than in a small colony. That is why this threshold value is not very useful in practice.
In fact, each colony shows its own mite drop pattern. The issue now is whether these differences in mite drop patterns per day are indicative for the ability of the colony to deal with and survive Varroa. By now, we know from research that untreated colonies develop various mechanisms to survive Varroa.
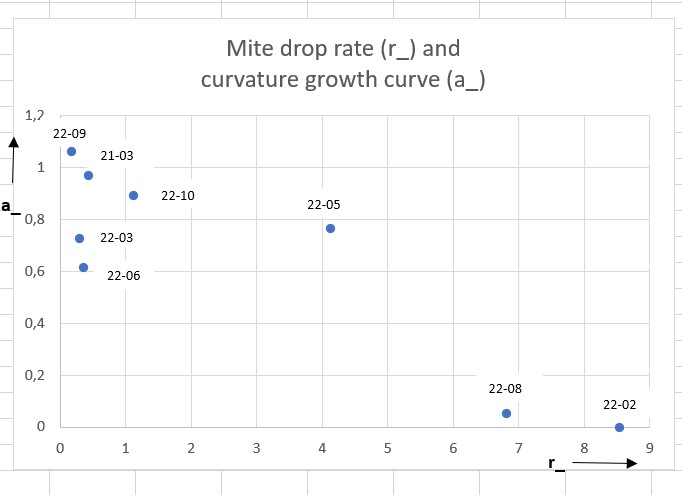
The cumulative mite drop curves previously discussed are defined by a number of parameters: a_ = the curvature at the beginning of the curve; b_ = the deflection at the end of the curve; r_ = the rate of mite drop (in mites per day), i.e. the steepness of the curve; Y0 = the mite drop at the start of the count; and K = the maximum number of mites fallen.
 |  |
Below, in a graph for 8 untreated colonies in my apiary, the values for (a_, r_) are plotted, with r_ on the horizontal and a_ on the vertical axis. All r_ values above 2 are bad in my estimation. Based on this assumption, at least the colonies 22-02, 22-05 and 22-08 are eliminated for propagation. The colonies 22-03 and 22-06 have a low a_ and a low r_ and are therefore eligible for propagation, provided they are also satisfactory in other respects, of course.